| Version: | 2.4 |
| Date: | 2023-8-30 |
| Title: | Statistical Learning Functions |
| Author: | Carlos Javier Hellin Asensio [aut, cre], Jose Manuel Gomez Caceres [aut], Dennis Monheimius [aut], Eduardo Benito [aut], Juan Jose Cuadrado [aut], Universidad de Alcala de Henares [aut] |
| Maintainer: | Carlos Javier Hellin Asensio <carlos.hellin@uah.es> |
| Depends: | magick, crayon |
| Suggests: | knitr, rmarkdown |
| Description: | Aids in learning statistical functions incorporating the result of calculus done with each function and how they are obtained, that is, which equation and variables are used. Also for all these equations and their related variables detailed explanations and interactive exercises are also included. All these characteristics allow to the package user to improve the learning of statistics basics by means of their use. |
| License: | Unlimited |
| VignetteBuilder: | knitr |
| NeedsCompilation: | yes |
| Type: | Package |
| Packaged: | 2023-08-30 17:27:14 UTC; carlos |
| Repository: | CRAN |
| Date/Publication: | 2023-08-30 22:10:03 UTC |
| RoxygenNote: | 7.1.1 |
| Encoding: | UTF-8 |
Statistical Learning Functions
Description
Package used to teach basic statistics to students.
Details
This package pretends to serve the user as a method of learning basic statistical functions at secondary and baccalaureate courses. The content of the package incorporate a serie of statistical functions like the calculus of the arithmetic mean or the calculus of the frequencies. There is no only calculus functions, further more, there are incorporated interactive and explicative functions to help and guide the user in the learning process.
Author(s)
Jose Manuel Gomez Caceres, josemanuel.gomezc@edu.uah.es
Dennis Monheimius, dennis.monhemimius@edu.uah.es
Eduardo Benito, eduardo.benito@edu.uah.es
Juan Jose Cuadrado, jjcg@uah.es
Universidad de Alcala de Henares
Maintainer: Eduardo Benito eduardo.benito@edu.uah.com
Average Absolute Deviation Function
Description
This function calculates the average absolute deviation of a numbers vector.
Usage
averageDeviation_(x)
Arguments
x |
Should be a numbers vector |
Details
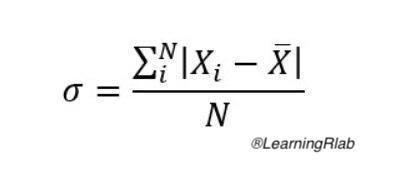
To calculate the average deviation, the user should give a numbers vector. The result is the sum of the differences in absolute value between each vector element and the mean, divided by the number of elemets. The average absolute deviation formule is the following:
Value
Numeric, the average absolute deviation of the numbers vector.
Note
A vector is created by c(), like c(1,2,3,4,5) creates a vector with the numbers: 1,2,3,4,5
Author(s)
Dennis Monheimius, dennis.monhemimius@edu.uah.es
Eduardo Benito, eduardo.benito@edu.uah.es
Juan Jose Cuadrado, jjcg@uah.es
Universidad de Alcala de Henares
Examples
#data creation
data <- c(1:20)
result = averageDeviation_(data)
Binomial Distribution Calculus Function
Description
This function calculates the binomial distribution of experiment.
Usage
binomial_(n,x,p)
Arguments
x |
Should be a numbers. |
n |
Should be a numbers. |
p |
Should be a numbers. |
Details
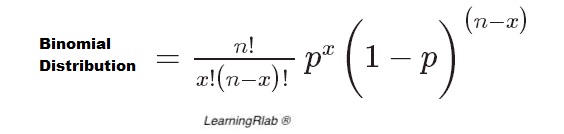
To calculate the binomial distribution, the user should give three number (the number of trials, probability of success and binomial random variable). The result is a discrete probability distribution that counts the number of successes in a sequence of n independent Bernoulli trials with a fixed probability p of occurrence of success between trials. The binomial distribution formule is the following:
Value
Numeric, the binomial distribution of three variables.
Note
Each variable is a number. Example: n <- 3 | x <- 2 | p <- 0.7
Author(s)
Jose Manuel Gomez Caceres, josemanuel.gomezc@edu.uah.es
Juan Jose Cuadrado, jjcg@uah.es
Universidad de Alcala de Henares
Examples
    #data creation
    n = 3
    x = 2
    p = 0.7
    binomial_(n,x,p)
Chisquared Distribution Calculus Function
Description
This function calculates the chisquared distribution of two vectors of numbers.
Usage
chisquared_(x,y)
Arguments
x |
Should be a vector. |
y |
Should be a vector. |
Details
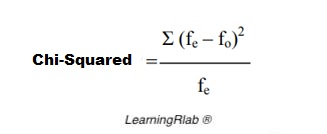
To calculate the chisquared distribution, the user should give two vectors of numbers. The result is a sum of the squares of k independent standard normal random variables. The chisquared distribution formule is the following:
Value
Numeric, the chisquared distribution of two vectors of numbers.
Note
A vector is created by c(), like c(1,2,3,4,5) creates a vector with the numbers: 1,2,3,4,5
Author(s)
Jose Manuel Gomez Caceres, josemanuel.gomezc@edu.uah.es
Juan Jose Cuadrado, jjcg@uah.es
Universidad de Alcala de Henares
Examples
    #data creation
    data = c(1,4,3,3,2,5,7,12,1,2,3,12)
    data2 = c(1,2,4,4,6,5,11,2,10,5,6,1)
    chisquared_(data, data2)
Coariance Calculus Function
Description
This function calculates the covariance of two vectors of numbers.
Usage
covariance_(x,y)
Arguments
x |
Should be a vector |
y |
Should be a vector |
Details
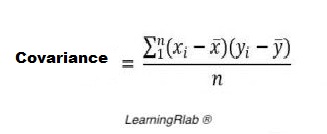
To calculate the covariance, the user should give two vectors of numbers. The result is a measure of the joint variability of two vectors of numbers. The covariance formule is the following:
Value
Numeric, the covariance of two vectors of numbers.
Note
A vector is created by c(), like c(1,2,3,4,5) creates a vector with the numbers: 1,2,3,4,5
Author(s)
Dennis Monheimius, dennis.monhemimius@edu.uah.es
Eduardo Benito, eduardo.benito@edu.uah.es
Juan Jose Cuadrado, jjcg@uah.es
Universidad de Alcala de Henares
Examples
    #data creation
    data = c(1,4,3,3,2,5,7,12,1,2,3,12)
    data2 = c(1,2,4,4,6,5,11,2,10,5,6,1)
    covariance_(data, data2)
Coefficient of Variation Calculus Function
Description
This function calculates the coefficient of variation of a numbers vector.
Usage
cv_(x)
Arguments
x |
Should be a numbers vector |
Details
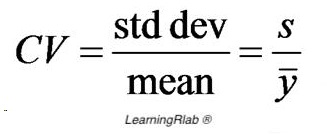
To calculate the coefficient of variation, the user should give a numbers vector. The result is defined as the ratio of the standard deviation to the mean. The coefficient of variation formule is the following:
Value
Numeric, the coefficient of variation of the numbers vector.
Note
A vector is created by c(), like c(1,2,3,4,5) creates a vector with the numbers: 1,2,3,4,5
Author(s)
Jose Manuel Gomez Caceres, josemanuel.gomezc@edu.uah.es
Juan Jose Cuadrado, jjcg@uah.es
Universidad de Alcala de Henares
Examples
    #data creation
    data = c(1,4,3,3,2,5,7,12,1,2,3,12)

    cv_(data)
Draw Vector Function
Description
This function prints all the elements of a vector
Usage
drawVector(buffer)
Arguments
buffer |
A vector of elements |
Value
There isn't return value, prints on screen
Note
A vector is created by c(), like c(1,2,3,4,5) creates a vector with the numbers: 1,2,3,4,5 or c(true,false,false) creates a vector with the booleans: true, false, true
Author(s)
Dennis Monheimius, dennis.monhemimius@edu.uah.es
Eduardo Benito, eduardo.benito@edu.uah.es
Juan Jose Cuadrado, jjcg@uah.es
Universidad de Alcala de Henares
Examples
{
  #data creation
  data <- c(1:12)
  drawVector(data)
  }
Absolute Accumulated Frecuency Calculus Explained
Description
Step by step demonstration of the absolute accumulated frecuency calculus
Usage
explain.absolute_acum_frecuency(v,x)
Arguments
v |
Should be a vector |
x |
Should be a number |
Details
To calculate the absolute accumulated frecuency, the user should give a vector and a number. We can saw the absolute accumulated frecuency formule in the frecuency_acum_absolute help document.
Value
A demonstration of the calculus process
Note
A vector is created by c(), like c(1,2,3,4,5) creates a vector with the numbers: 1,2,3,4,5
Author(s)
Dennis Monheimius, dennis.monhemimius@edu.uah.es
Eduardo Benito, eduardo.benito@edu.uah.es
Juan Jose Cuadrado, jjcg@uah.es
Universidad de Alcala de Henares
Examples
{
    #data creation
    data <- c(1,2,2,5,10,4,2)
    value = 2
    #function execution
    explain.absolute_acum_frecuency(data, value)
}
Absolute Frecuency Calculus Explained
Description
Step by step demonstration of the absolute frecuency calculus
Usage
explain.absolute_frecuency(v,x)
Arguments
v |
Should be a vector |
x |
Should be a number |
Details
To calculate the absolute frecuency, the user should give a vector and a number. We can saw the absolute frecuency formule in the frecuency_abs help document.
Value
A demonstration of the calculus process
Note
A vector is created by c(), like c(1,2,3,4,5) creates a vector with the numbers: 1,2,3,4,5
Author(s)
Dennis Monheimius, dennis.monhemimius@edu.uah.es
Eduardo Benito, eduardo.benito@edu.uah.es
Juan Jose Cuadrado, jjcg@uah.es
Universidad de Alcala de Henares
Examples
{
    #data creation
    data <- c(1,2,2,5,10,4,2)
    value = 2
    #function execution
    explain.absolute_frecuency(data, value)
}
Average Absolute Deviation Function Explained
Description
Step by step demonstration of the average absolute deviation calculus.
Usage
explain.averageDeviation(x)
Arguments
x |
Should be a numbers vector |
Details
To calculate the average absolute deviation, the user should give a numbers vector. The result is the explained process to calculate the average absolute deviation, with the data of the dataset provided like argument. We can saw the average absolute deviation formule in the averageDeviation_ help document.
Value
Numeric, the average absolute deviation of the numbers vector.
Note
A vector is created by c(), like c(1,2,3,4,5) creates a vector with the numbers: 1,2,3,4,5
Author(s)
Dennis Monheimius, dennis.monhemimius@edu.uah.es
Eduardo Benito, eduardo.benito@edu.uah.es
Juan Jose Cuadrado, jjcg@uah.es
Universidad de Alcala de Henares
Examples
  #data creation
  data <- c(7,2,5,7,1,4,12)

  explain.averageDeviation(data)
Binomial Distribution Function Explained
Description
Step by step demonstration of the binomial distribution calculus.
Usage
explain.binomial(n,x,p)
Arguments
x |
Should be a numbers. |
n |
Should be a numbers. |
p |
Should be a numbers. |
Details
To calculate the binomial distribution, the user should give three number (the number of trials, probability of success and binomial random variable). The result is a discrete probability distribution that counts the number of successes in a sequence of n independent Bernoulli trials with a fixed probability p of occurrence of success between trials. We can saw the binomial distribution formule in the binomial_ help document.
Value
Numeric result and the process of this calculus explained.
Note
Each variable is a number. Example: n <- 3 | x <- 2 | p <- 0.7
Author(s)
Jose Manuel Gomez Caceres, josemanuel.gomezc@edu.uah.es
Juan Jose Cuadrado, jjcg@uah.es
Universidad de Alcala de Henares
Examples
  #data creation
  n = 3
  x = 2
  p = 0.7

  explain.binomial(n,x,p)
Chisquared Distribution Function Explained
Description
Step by step demonstration of the chisquared distribution calculus.
Usage
explain.chisquared(x,y)
Arguments
x |
Should be a vector. |
y |
Should be a vector. |
Details
To calculate the chisquared distribution, the user should give two vectors of numbers. The result is a sum of the squares of k independent standard normal random variables. We can saw the chisquared distribution formule in the chisquared_ help document.
Value
Numeric result and the process of this calculus explained.
Note
A vector is created by c(), like c(1,2,3,4,5) creates a vector with the numbers: 1,2,3,4,5
Author(s)
Jose Manuel Gomez Caceres, josemanuel.gomezc@edu.uah.es
Juan Jose Cuadrado, jjcg@uah.es
Universidad de Alcala de Henares
Examples
  #data creation
  data <- c(10,4,5,7,3,4,1)
  data2 <- c(1,8,3,4,4,5,7)

  explain.chisquared(data, data2)
Covariance Function Explained
Description
Step by step demonstration of the covariance calculus.
Usage
explain.covariance(x,y)
Arguments
x |
Should be a vector |
y |
Should be a vector |
Details
To calculate the covariance, the user should give two vectors of numbers. The result is the explained process to calculate the covariance, with the data of the datasets provided like argument. We can saw the harmonic mean formule in the covariance_ help document.
Value
Numeric result and the process of this calculus explained.
Note
A vector is created by c(), like c(1,2,3,4,5) creates a vector with the numbers: 1,2,3,4,5
Author(s)
Jose Manuel Gomez Caceres, josemanuel.gomezc@edu.uah.es
Juan Jose Cuadrado, jjcg@uah.es
Universidad de Alcala de Henares
Examples
  #data creation
  data <- c(10,4,5,7,3,4,1)
  data2 <- c(1,8,3,4,4,5,7)

  explain.covariance(data, data2)
Coefficient of Variation Function Explained
Description
Step by step demonstration of the coefficient of variation calculus.
Usage
explain.cv(x)
Arguments
x |
Should be a numbers vector |
Details
To calculate the coefficient of variation, the user should give a numbers vector. The result is defined as the ratio of the standard deviation to the mean. We can saw the coefficient of variation formule in the cv_ help document.
Value
Numeric result and the process of this calculus explained.
Note
A vector is created by c(), like c(1,2,3,4,5) creates a vector with the numbers: 1,2,3,4,5
Author(s)
Jose Manuel Gomez Caceres, josemanuel.gomezc@edu.uah.es
Juan Jose Cuadrado, jjcg@uah.es
Universidad de Alcala de Henares
Examples
  #data creation
  data <- c(10,4,5,7,3,4,1)

  explain.cv(data)
F Fisher Distribution Function Explained
Description
Step by step demonstration of the fisher distribution calculus.
Usage
explain.fisher(x,y)
Arguments
x |
Should be a vector |
y |
Should be a vector |
Details
To calculate the fisher distribution, the user should give two vectors of numbers. The result is a continuous probability distribution that arises frequently as the null distribution of a test statistic. We can saw fisher distribution formule in the fisher_ help document.
Value
Numeric result and the process of this calculus explained.
Note
A vector is created by c(), like c(1,2,3,4,5) creates a vector with the numbers: 1,2,3,4,5
Author(s)
Jose Manuel Gomez Caceres, josemanuel.gomezc@edu.uah.es
Juan Jose Cuadrado, jjcg@uah.es
Universidad de Alcala de Henares
Examples
  #data creation
  data <- c(10,4,5,7,3,4,1)
  data2 <- c(1,8,3,4,4,5,7)

  explain.fisher(data, data2)
Geometric Mean Function Explained
Description
Step by step demonstration of the geometric mean calculus.
Usage
explain.geometricMean(x)
Arguments
x |
Should be a numbers vector |
Details
To calculate the geometric mean of a dataset, the user should give a vector. The result is the explained process to calculate the geometric mean, with the data of the dataset provided like argument. We can saw the geometric mean formule in the geometricMean_ help document.
Value
Numeric result and the process of this calculus explained.
Note
A vector is created by c(), like c(1,2,3,4,5) creates a vector with the numbers: 1,2,3,4,5
Author(s)
Dennis Monheimius, dennis.monhemimius@edu.uah.es
Eduardo Benito, eduardo.benito@edu.uah.es
Juan Jose Cuadrado, jjcg@uah.es
Universidad de Alcala de Henares
Examples
{
    #data creation
    data <- c(5,21,12,7,3,9,1)

    explain.geometricMean(data)
}
Harmonic Mean Function Explained
Description
Step by step demonstration of the harmonic mean calculus.
Usage
explain.harmonicMean(x)
Arguments
x |
Should be a numbers vector |
Details
To calculate the harmonic mean, the user should give a numbers vector. The result is the explained process to calculate the harmonic mean, with the data of the dataset provided like argument. We can saw the harmonic mean formule in the harmonicMean_ help document.
Value
Numeric result and the process of this calculus explained.
Note
A vector is created by c(), like c(1,2,3,4,5) creates a vector with the numbers: 1,2,3,4,5
Author(s)
Jose Manuel Gomez Caceres, josemanuel.gomezc@edu.uah.es
Juan Jose Cuadrado, jjcg@uah.es
Universidad de Alcala de Henares
Examples
  #data creation
  data <- c(10,4,5,7,3,4,1)

  explain.harmonicMean(data)
Laplace's Rule Function Explained
Description
Step by step demonstration of the Laplace's rule calculus.
Usage
explain.laplace(x,y)
Arguments
x |
Should be a vector |
y |
Should be a vector |
Details
To calculate the Laplace's rule, the user should give two vector (unfavorable cases/favorable cases). The result isas the quotient between the number of favorable cases to A, and that of all possible results of the experiment. We can saw the Laplace's rule correlation formule in the laplace_ help document.
Value
Numeric result and the process of this calculus explained.
Note
A vector is created by c(), like c(1,2,3,4,5) creates a vector with the numbers: 1,2,3,4,5
Author(s)
Jose Manuel Gomez Caceres, josemanuel.gomezc@edu.uah.es
Juan Jose Cuadrado, jjcg@uah.es
Universidad de Alcala de Henares
Examples
  #data creation
  data <- 3
  data2 <- c(1,2,3,4,5,6)

  explain.laplace(data, data2)
Mean Function Explained
Description
Step by step demonstration of the arithmetic mean calculus.
Usage
explain.mean(x)
Arguments
x |
Should be a numbers vector |
Details
To calculate the arithmetic mean of a dataset, the user should give a vector. The result is the explained process to calculate the arithmetic mean, with the data of the dataset provided like argument. We can saw the arithmetic mean formule in the mean_ help document.
Value
Numeric result and the process of this calculus explained.
Note
A vector is created by c(), like c(1,2,3,4,5) creates a vector with the numbers: 1,2,3,4,5
Author(s)
Dennis Monheimius, dennis.monhemimius@edu.uah.es
Eduardo Benito, eduardo.benito@edu.uah.es
Juan Jose Cuadrado, jjcg@uah.es
Universidad de Alcala de Henares
Examples
{
    #data creation
    data <- c(1,2,2,5,10,4,2)

    explain.mean(data)
}
Median Function Explained
Description
Step by step demonstration of the median calculus.
Usage
explain.median(x)
Arguments
x |
Should be a numbers vector |
Details
To calculate the median, the user should give a numbers vector. The result is the explained process to calculate the median, with the data of the dataset provided like argument. We can saw the median formule in the median_ help document.
Value
Numeric result and the process of this calculus explained.
Note
A vector is created by c(), like c(1,2,3,4,5) creates a vector with the numbers: 1,2,3,4,5
Author(s)
Dennis Monheimius, dennis.monhemimius@edu.uah.es
Eduardo Benito, eduardo.benito@edu.uah.es
Juan Jose Cuadrado, jjcg@uah.es
Universidad de Alcala de Henares
Examples
{
    #data creation
    data <- c(1,2,2,5,10,4,2)

    explain.median(data)
}
Mode Function Explained
Description
Step by step demonstration of the mode calculus.
Usage
explain.mode(x)
Arguments
x |
Should be a numbers vector |
Details
To calculate the mode, the user should give a numbers vector. The result is the explained process to calculate the mode, with the data of the dataset provided like argument. We can saw the mode formule in the mode_ help document.
Value
Numeric result and the process of this calculus explained.
Note
A vector is created by c(), like c(1,2,3,4,5) creates a vector with the numbers: 1,2,3,4,5
Author(s)
Dennis Monheimius, dennis.monhemimius@edu.uah.es
Eduardo Benito, eduardo.benito@edu.uah.es
Juan Jose Cuadrado, jjcg@uah.es
Universidad de Alcala de Henares
Examples
  {
    #data creation
    data <- c(1,1,2,5,2,3,1,4,1)

    explain.mode(data)

  }
Normal Distribution Function Explained
Description
Step by step demonstration of the normal distribution calculus.
Usage
explain.normal(x)
Arguments
x |
Should be a number. |
Details
To calculate the normal distribution, the user should give a number. The result isis a type of continuous probability distribution for a real-valued random variable. We can saw the normal distribution correlation formule in the normal_ help document.
Value
Numeric result and the process of this calculus explained.
Note
The variable is a number. Example: x <- 0.1
Author(s)
Jose Manuel Gomez Caceres, josemanuel.gomezc@edu.uah.es
Juan Jose Cuadrado, jjcg@uah.es
Universidad de Alcala de Henares
Examples
    #data creation
    x = 0.1

    explain.normal(x)
Pearson Correlation Function Explained
Description
Step by step demonstration of the pearson correlation calculus.
Usage
explain.pearson(x,y)
Arguments
x |
Should be a vector |
y |
Should be a vector |
Details
To calculate the pearson correlation, the user should give two vectors of numbers. The result is the covariance of the two vectors of numbers divided by the product of their standard deviations. We can saw the pearson correlation formule in the pearson_ help document.
Value
Numeric result and the process of this calculus explained.
Note
A vector is created by c(), like c(1,2,3,4,5) creates a vector with the numbers: 1,2,3,4,5
Author(s)
Jose Manuel Gomez Caceres, josemanuel.gomezc@edu.uah.es
Juan Jose Cuadrado, jjcg@uah.es
Universidad de Alcala de Henares
Examples
  #data creation
  data <- c(10,4,5,7,3,4,1)
  data2 <- c(1,8,3,4,4,5,7)

  explain.pearson(data, data2)
Percentiles Calculus Explained
Description
Step by step demonstration of the percentiles calculus
Usage
explain.percentile(x)
Arguments
x |
Should be a vector |
Details
To calculate the percentiles, the user should give a vector. We can saw the percentile formule in the percentile_ help document.
Value
A demonstration of the calculus process
Note
A vector is created by c(), like c(1,2,3,4,5) creates a vector with the numbers: 1,2,3,4,5
Author(s)
Dennis Monheimius, dennis.monhemimius@edu.uah.es
Eduardo Benito, eduardo.benito@edu.uah.es
Juan Jose Cuadrado, jjcg@uah.es
Universidad de Alcala de Henares
Examples
{
    #data creation
    data <- c(1,2,2,5,10,4,2)

    explain.percentile(data)
}
Poisson Distribution Function Explained
Description
Step by step demonstration of the Poisson distribution calculus.
Usage
explain.poisson(k,lam)
Arguments
k |
Should be a numbers |
lam |
Should be a numbers |
Details
To calculate the Poisson distribution, the user should give two number ( the number of times the phenomenon and the number of occurrences). The result is a discrete probability distribution that expresses, from a mean frequency of occurrence, the probability that a certain number of events will occur during a certain period of time. We can saw the Poisson distribution correlation formule in the poisson_ help document.
Value
Numeric result and the process of this calculus explained.
Note
Each variable is a number. Example: lam <- 2 | k <- 3
Author(s)
Jose Manuel Gomez Caceres, josemanuel.gomezc@edu.uah.es
Juan Jose Cuadrado, jjcg@uah.es
Universidad de Alcala de Henares
Examples
    #data creation
    lam = 2
    k = 3
    explain.poisson(k,lam)
Quartiles Calculus Explained
Description
Step by step demonstration of the quartiles calculus
Usage
explain.quartile(x)
Arguments
x |
Should be a vector |
Details
To calculate the quartiles, the user should give a vector. We can saw the quartile formule in the quartile_ help document.
Value
A demonstration of the calculus process
Note
A vector is created by c(), like c(1,2,3,4,5) creates a vector with the numbers: 1,2,3,4,5
Author(s)
Dennis Monheimius, dennis.monhemimius@edu.uah.es
Eduardo Benito, eduardo.benito@edu.uah.es
Juan Jose Cuadrado, jjcg@uah.es
Universidad de Alcala de Henares
Examples
{
    #data creation
    data <- c(1,2,2,5,10,4,2)

    explain.quartile(data)
}
Relative Accumulated Frecuency Calculus Explained
Description
Step by step demonstration of the relative accumulated frecuency calculus
Usage
explain.relative_acum_frecuency(v,x)
Arguments
v |
Should be a vector |
x |
Should be a numebr of the vector |
Details
To calculate the relative accumulated frecuency, the user should give a vector and a number. We can saw the relative accumulated frecuency formule in the frecuency_acum_relative help document.
Value
A demonstration of the calculus process
Note
A vector is created by c(), like c(1,2,3,4,5) creates a vector with the numbers: 1,2,3,4,5
Author(s)
Dennis Monheimius, dennis.monhemimius@edu.uah.es
Eduardo Benito, eduardo.benito@edu.uah.es
Juan Jose Cuadrado, jjcg@uah.es
Universidad de Alcala de Henares
Examples
{
    #data creation
    data <- c(1,2,2,5,10,4,2)
    value = 2
    #function execution
    explain.relative_acum_frecuency(data, value)
}
Relative Frecuency Calculus Explained
Description
Step by step demonstration of the relative frecuency calculus
Usage
explain.relative_frecuency(v,x)
Arguments
v |
Should be a vector |
x |
Should be a number |
Details
To calculate the relative frecuency, the user should give a vector and a number. We can saw the relative frecuency formule in the frecuency_relative help document.
Value
A demonstration of the calculus process
Note
A vector is created by c(), like c(1,2,3,4,5) creates a vector with the numbers: 1,2,3,4,5
Author(s)
Dennis Monheimius, dennis.monhemimius@edu.uah.es
Eduardo Benito, eduardo.benito@edu.uah.es
Juan Jose Cuadrado, jjcg@uah.es
Universidad de Alcala de Henares
Examples
{
    #data creation
    data <- c(1,2,2,5,10,4,2)
    value = 2
    #function execution
    explain.relative_frecuency(data, value)
}
Standard Deviation Function Explained
Description
Step by step demonstration of the standard deviation calculus.
Usage
explain.standardDeviation(x)
Arguments
x |
Should be a numbers vector |
Details
To calculate the standard deviation, the user should give a numbers vector. The result is the explained process to calculate the standard deviation, with the data of the dataset provided like argument. We can saw the standard deviation formule in the standardDeviation_ help document.
Value
Numeric result and the process of this calculus explained.
Note
A vector is created by c(), like c(1,2,3,4,5) creates a vector with the numbers: 1,2,3,4,5
Author(s)
Dennis Monheimius, dennis.monhemimius@edu.uah.es
Eduardo Benito, eduardo.benito@edu.uah.es
Juan Jose Cuadrado, jjcg@uah.es
Universidad de Alcala de Henares
Examples
    #data creation
    data <- c(1,5,3,7,10,4,2)

    explain.standardDeviation(data)
T-Student Distribution Function Explained
Description
Step by step demonstration of the T-Student distribution calculus.
Usage
explain.tstudent(x,u,s,n)
Arguments
x |
Should be a number |
u |
Should be a number |
s |
Should be a number |
n |
Should be a number |
Details
To calculate the T-Student distribution, the user should give four number (sample mean, population mean, population standard deviation and sample size). The result is a probability distribution that arises from the problem of estimating the mean of a normally distributed population when the sample size is small. We can saw the T-Student distribution formule in the tstudent_ help document.
Value
Numeric result and the process of this calculus explained.
Note
Each variable is a number. Example: x <- 2 | y <- 4
Author(s)
Jose Manuel Gomez Caceres, josemanuel.gomezc@edu.uah.es
Juan Jose Cuadrado, jjcg@uah.es
Universidad de Alcala de Henares
Examples
   #data creation
    x = 52.9
    u = 50
    s = 3
    n = 10

    explain.tstudent(x,u,s,n)
Variance Function Explained
Description
Step by step demonstration of the variance calculus.
Usage
explain.variance(x)
Arguments
x |
Should be a numbers vector |
Details
To calculate the variance, the user should give a numbers vector. The result is the explained process to calculate the variance, with the data of the dataset provided like argument. We can saw the variance formule in the variance_ help document.
Value
Numeric result and the process of this calculus explained.
Note
A vector is created by c(), like c(1,2,3,4,5) creates a vector with the numbers: 1,2,3,4,5
Author(s)
Dennis Monheimius, dennis.monhemimius@edu.uah.es
Eduardo Benito, eduardo.benito@edu.uah.es
Juan Jose Cuadrado, jjcg@uah.es
Universidad de Alcala de Henares
Examples
  #data creation
  data <- c(10,4,5,7,3,4,1)

  explain.variance(data)
F Fisher Distribution Calculus Function
Description
This function calculates the fisher distribution of a numbers vector.
Usage
fisher_(x,y)
Arguments
x |
Should be a vector |
y |
Should be a vector |
Details
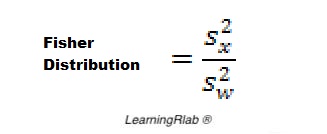
To calculate the fisher distribution, the user should give two vectors of numbers. The result is a continuous probability distribution that arises frequently as the null distribution of a test statistic. The fisher distributionformule is the following:
Value
Numeric, the fisher distribution.
Note
A vector is created by c(), like c(1,2,3,4,5) creates a vector with the numbers: 1,2,3,4,5
Author(s)
Jose Manuel Gomez Caceres, josemanuel.gomezc@edu.uah.es
Juan Jose Cuadrado, jjcg@uah.es
Universidad de Alcala de Henares
Examples
    #data creation
    x <- c(70,75,74,72,68,59)
    y <- c(74,77,70,80,72,76)

    fisher_(x,y)
Absolute Frecuency Calculus
Description
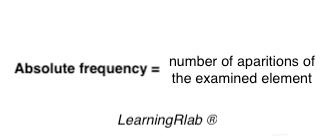
This function calculate the number of times that a specific number appears in the data set.
Usage
frecuency_abs(v,x)
Arguments
v |
Should be a vector |
x |
Should be a number |
Details
The absolute frecuency formula is the following:
Value
An integer that represents the number of times that the value appears in the vector
Note
A vector is created by c(), like c(1,2,3,4,5) creates a vector with the numbers: 1,2,3,4,5
Author(s)
Dennis Monheimius, dennis.monhemimius@edu.uah.es
Eduardo Benito, eduardo.benito@edu.uah.es
Juan Jose Cuadrado, jjcg@uah.es
Universidad de Alcala de Henares
Examples
  {
    #data creation
    data = c(1,4,3,3,2,5,7,12,1,2,3,12)
    value = 12
    #function execution
    frecuency_abs(data, value)
  }
Accumulated Absolute Frecuency Calculus
Description
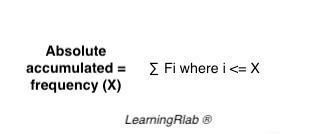
This function calculate the number of times that a specific number appears in the data set. The value depends on the elements that are lower than itself
Usage
frecuency_absolute_acum(v,x)
Arguments
v |
Should be a vector |
x |
Should be a number |
Details
The accumulated absolute frecuency formula is the following:
Value
A double that represents the number of times that the value appears in the vector regarding the total of elements
Note
A vector is created by c(), like c(1,2,3,4,5) creates a vector with the numbers: 1,2,3,4,5
Author(s)
Dennis Monheimius, dennis.monhemimius@edu.uah.es
Eduardo Benito, eduardo.benito@edu.uah.es
Juan Jose Cuadrado, jjcg@uah.es
Universidad de Alcala de Henares
Examples
{
    #data creation
    data = c(1,4,3,3,2,5,7,12,1,2,3,12)
    value = 12
    #function execution
    frecuency_absolute_acum(data, value)

    }
Relative Frecuency Calculus
Description
This function calculate the number of times that a specific number appears in the data set divided by the total length of the vector.
Usage
frecuency_relative(v,x)
Arguments
v |
Should be a vector |
x |
Should be a number |
Details
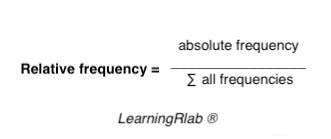
The relative frecuency formula is the following:
Value
A double that represents the number of times that the value appears in the vector regarding the total of elements
Note
A vector is created by c(), like c(1,2,3,4,5) creates a vector with the numbers: 1,2,3,4,5
Author(s)
Dennis Monheimius, dennis.monhemimius@edu.uah.es
Eduardo Benito, eduardo.benito@edu.uah.es
Juan Jose Cuadrado, jjcg@uah.es
Universidad de Alcala de Henares
Examples
    {
    #data creation
    data <- c(1,4,3,3,2,5,7,12,1,2,3,12)
    value = 12
    frecuency_relative(data, value)
    }
Accumulated Relative Frecuency Calculus
Description
This function calculate the number of times that a specific number appears in the data set divided by the total length of the vector. The value depends on the elements that are lower than itself
Usage
frecuency_relative_acum(v,x)
Arguments
v |
Should be a vector |
x |
Should be a number |
Details
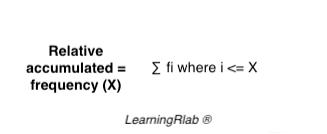
The accumulated relative frecuency formula is the following:
Value
A double that represents the number of times that the value appears in the vector regarding the total of elements
Note
A vector is created by c(), like c(1,2,3,4,5) creates a vector with the numbers: 1,2,3,4,5
Author(s)
Dennis Monheimius, dennis.monhemimius@edu.uah.es
Eduardo Benito, eduardo.benito@edu.uah.es
Juan Jose Cuadrado, jjcg@uah.es
Universidad de Alcala de Henares
Examples
{
    #data creation
    data = c(1,4,3,3,2,5,7,12,1,2,3,12)
    value = 12
    #function execution
    frecuency_relative_acum(data, value)

    }
Geometric Mean Function
Description
This function calculates the geometric mean of a numbers vector.
Usage
geometricMean_(x)
Arguments
x |
Should be a numbers vector |
Details
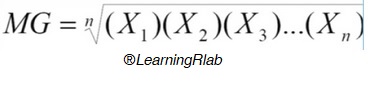
To calculate the geometric mean of a dataset, the user should give a numbers vector. The result is the product of all vector elements raise to 1 divided by the number of elements. The arithmetic mean formule is the following:
Value
A numeric, the geometric mean of the numbers vector.
Note
A vector is created by c(), like c(1,2,3,4,5) creates a vector with the numbers: 1,2,3,4,5
Author(s)
Dennis Monheimius, dennis.monhemimius@edu.uah.es
Eduardo Benito, eduardo.benito@edu.uah.es
Juan Jose Cuadrado, jjcg@uah.es
Universidad de Alcala de Henares
Examples
  #data creation
  data = c(1:20)

  geometricMean_(data)
Get User Action Funcion
Description
This function get the buffer introduced by the user. Typically a numerical vector.
Usage
getUserAction()
Value
A vector
Note
The process is interactive with the user
Author(s)
Dennis Monheimius, dennis.monhemimius@edu.uah.es
Eduardo Benito, eduardo.benito@edu.uah.es
Juan Jose Cuadrado, jjcg@uah.es
Universidad de Alcala de Henares
Examples
{
  ## Not run:
  vector <- getUserAction()

## End(Not run)
  }
Harmonic Mean Function
Description
This function calculates the harmonic mean of a numbers vector.
Usage
harmonicMean_ (x)
Arguments
x |
Should be a numbers vector |
Details
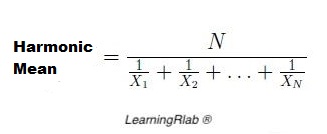
To calculate the harmonic mean, the user should give a numbers vector. The result is calculated by dividing the number of observations by the reciprocal of each number in the vector. The harmonic mean formule is the following:
Value
Numeric, the harmonic mean of the numbers vector.
Note
A vector is created by c(), like c(1,2,3,4,5) creates a vector with the numbers: 1,2,3,4,5
Author(s)
Jose Manuel Gomez Caceres, josemanuel.gomezc@edu.uah.es
Juan Jose Cuadrado, jjcg@uah.es
Universidad de Alcala de Henares
Examples
    #data creation
    data = c(1,4,3,3,2,5,7,12,1,2,3,12)

    harmonicMean_(data)
Init Images Function
Description
This function is used to display an image.
Usage
initImages(path)
Arguments
path |
An url of an image |
Value
There isn't return value
Note
The path shold be toward an image
Author(s)
Dennis Monheimius, dennis.monhemimius@edu.uah.es
Eduardo Benito, eduardo.benito@edu.uah.es
Juan Jose Cuadrado, jjcg@uah.es
Universidad de Alcala de Henares
Examples
{

  ## Not run:
    path = "https://i.imgur.com/8237YhzJ.png"
  initImages(path)


## End(Not run)
  }
User Interactive Absolute Accumulated Frecuency Calculus
Description
Interactive function for absolute accumulated frecuency calculus.
Usage
interactive.absolute_acum_frecuency()
Details
The user provides the dataset when the function needs it. After that, the function will ask what is the correct result for this dataset. The function itself will provide the formula.
Value
An interactive process to calculate the absolute accumulated frecuency
Author(s)
Dennis Monheimius, dennis.monhemimius@edu.uah.es
Eduardo Benito, eduardo.benito@edu.uah.es
Juan Jose Cuadrado, jjcg@uah.es
Universidad de Alcala de Henares
Examples
  ## Not run:
  interactive.absolute_acum_frecuency()

## End(Not run)
User Interactive Absolute Frecuency Calculus
Description
Interactive function for absolute frecuency calculus.
Usage
interactive.absolute_frecuency()
Details
The user provides the dataset when the function needs it. After that, the function will ask what is the correct result for this dataset. The function itself will provide the formula.
Value
An interactive process to calculate the absolute frecuency
Author(s)
Dennis Monheimius, dennis.monhemimius@edu.uah.es
Eduardo Benito, eduardo.benito@edu.uah.es
Juan Jose Cuadrado, jjcg@uah.es
Universidad de Alcala de Henares
Examples
  ## Not run:
  interactive.absolute_frecuency()

## End(Not run)
User Interactive Average Absolute Deviation Calculus
Description
Interactive function for average absolute deviation calculus.
Usage
interactive.averageDeviation()
Details
The user provides the dataset when the function needs it. After that, the function will ask what is the correct result for this dataset. The function itself will provide the average absolute deviation formule, apart from the averageDeviation_ help document.
Value
An interactive process to calculate the average absolute deviation
Author(s)
Dennis Monheimius, dennis.monhemimius@edu.uah.es
Eduardo Benito, eduardo.benito@edu.uah.es
References
https://en.wikipedia.org/wiki/Average_absolute_deviation
Examples
   ## Not run:
  interactive.averageDeviation()

## End(Not run)
User Interactive Binomial Distribution Calculus
Description
Interactive function for binomial distribution calculus.
Usage
interactive.binomial()
Details
The user provides the values when the function needs it. After that, the function will ask what is the correct result for this datas. The function itself will provide the binomial distribution formule, apart from the binomial_ help document.
Value
An interactive process to calculate the binomial distribution.
Author(s)
Jose Manuel Gomez Caceres, josemanuel.gomezc@edu.uah.es
Juan Jose Cuadrado, jjcg@uah.es
Universidad de Alcala de Henares
Examples
  ## Not run:
  interactive.binomial()

## End(Not run)
User Interactive Chisquared Distribution Calculus
Description
Interactive function for chisquared distribution calculus.
Usage
interactive.chisquared()
Details
The user provides the datasets when the function needs it. After that, the function will ask what is the correct result for this dataset. The function itself will provide the chisquared distribution formule, apart from the chisquared_ help document.
Value
An interactive process to calculate the chisquared distribution
Author(s)
Jose Manuel Gomez Caceres, josemanuel.gomezc@edu.uah.es
Juan Jose Cuadrado, jjcg@uah.es
Universidad de Alcala de Henares
Examples
  ## Not run:
  interactive.chisquared()

## End(Not run)
User Interactive Covariance Calculus
Description
Interactive function for covariance calculus.
Usage
interactive.covariance()
Details
The user provides the datasets when the function needs it. After that, the function will ask what is the correct result for this dataset. The function itself will provide the covariance formule, apart from the covariance_ help document.
Value
An interactive process to calculate the covariance
Author(s)
Jose Manuel Gomez Caceres, josemanuel.gomezc@edu.uah.es
Juan Jose Cuadrado, jjcg@uah.es
Universidad de Alcala de Henares
Examples
  ## Not run:
  interactive.covariance()

## End(Not run)
User Interactive Coefficient of Variation Calculus
Description
Interactive function for Coefficient of Variation calculus.
Usage
interactive.cv()
Details
The user provides the dataset when the function needs it. After that, the function will ask what is the correct result for this dataset. The function itself will provide the coefficient of variation formule, apart from the cv_ help document.
Value
An interactive process to calculate the average absolute deviation
Author(s)
Jose Manuel Gomez Caceres, josemanuel.gomezc@edu.uah.es
Juan Jose Cuadrado, jjcg@uah.es
Universidad de Alcala de Henares
Examples
  ## Not run:
  interactive.cv()

## End(Not run)
User Interactive F Fisher Distribution Calculus
Description
Interactive function for fisher distribution calculus.
Usage
interactive.fisher()
Details
The user provides the datasets when the function needs it. After that, the function will ask what is the correct result for this datasets. The function itself will provide the fisher distribution formule, apart from the fisher_ help document.
Value
An interactive process to calculate the fisher distribution
Author(s)
Jose Manuel Gomez Caceres, josemanuel.gomezc@edu.uah.es
Juan Jose Cuadrado, jjcg@uah.es
Universidad de Alcala de Henares
Examples
  ## Not run:
  interactive.fisher()

## End(Not run)
User Interactive Geometric Mean Calculus
Description
Interactive function for geometric mean calculus.
Usage
interactive.geometricMean()
Details
The user provides the dataset when the function needs it. After that, the function will ask what is the correct result for this dataset. The function itself will provide the geometric mean formule, apart from the geometricMean_ help document.
Value
An interactive process to calculate the geometric mean.
Author(s)
Dennis Monheimius, dennis.monhemimius@edu.uah.es
Eduardo Benito, eduardo.benito@edu.uah.es
Juan Jose Cuadrado, jjcg@uah.es
Universidad de Alcala de Henares
Examples
  ## Not run:
  interactive.geometricMean()

## End(Not run)
User Interactive Harmonic Mean Calculus
Description
Interactive function for harmonic mean calculus.
Usage
interactive.harmonicMean()
Details
The user provides the dataset when the function needs it. After that, the function will ask what is the correct result for this dataset. The function itself will provide the harmonic mean formule, apart from the harmonicMean_ help document.
Value
An interactive process to calculate the harmonic mean
Author(s)
Jose Manuel Gomez Caceres, josemanuel.gomezc@edu.uah.es
Juan Jose Cuadrado, jjcg@uah.es
Universidad de Alcala de Henares
Examples
  ## Not run:
  interactive.harmonicMean()

## End(Not run)
User Interactive Laplace's Rule Calculus
Description
Interactive function for Laplace's rule calculus.
Usage
interactive.laplace()
Details
The user provides the values when the function needs it. After that, the function will ask what is the correct result for this datas. The function itself will provide the Laplace's rule formule, apart from the laplace_ help document.
Value
An interactive process to calculate the Laplace's rule.
Author(s)
Jose Manuel Gomez Caceres, josemanuel.gomezc@edu.uah.es
Juan Jose Cuadrado, jjcg@uah.es
Universidad de Alcala de Henares
Examples
  ## Not run:
  interactive.laplace()

## End(Not run)
User Interactive Mean Calculus
Description
Interactive function for arithmetic mean calculus.
Usage
interactive.mean()
Details
The user provides the dataset when the function needs it. After that, the function will ask what is the correct result for this dataset. The function itself will provide the arithmetic mean formule, apart from the mean_ help document.
Value
An interactive process to calculate the arithmetic mean.
Author(s)
Dennis Monheimius, dennis.monhemimius@edu.uah.es
Eduardo Benito, eduardo.benito@edu.uah.es
Juan Jose Cuadrado, jjcg@uah.es
Universidad de Alcala de Henares
Examples
{

  ## Not run:
  interactive.mean()

## End(Not run)
}
User Interactive Median Calculus
Description
Interactive function for median calculus.
Usage
interactive.median()
Details
The user provides the dataset when the function needs it. After that, the function will ask what is the correct result for this dataset. The function itself will provide the median formule, apart from the median_ help document.
Value
An interactive process to calculate the median
Author(s)
Dennis Monheimius, dennis.monhemimius@edu.uah.es
Eduardo Benito, eduardo.benito@edu.uah.es
Juan Jose Cuadrado, jjcg@uah.es
Universidad de Alcala de Henares
Examples
  ## Not run:
  interactive.median()

## End(Not run)
User Interactive Mode Calculus
Description
Interactive function for mode calculus.
Usage
interactive.mode()
Details
The user provides the dataset when the function needs it. After that, the function will ask what is the correct result for this dataset.
Value
An interactive process to calculate the mode.
Author(s)
Dennis Monheimius, dennis.monhemimius@edu.uah.es
Eduardo Benito, eduardo.benito@edu.uah.es
Juan Jose Cuadrado, jjcg@uah.es
Universidad de Alcala de Henares
Examples
  ## Not run:
  interactive.mode()

## End(Not run)
User Interactive Normal Distribution Calculus
Description
Interactive function for normal distribution calculus.
Usage
interactive.normal()
Details
The user provides the values when the function needs it. After that, the function will ask what is the correct result for this data. The function itself will provide the normal distribution formule, apart from the normal_ help document.
Value
An interactive process to calculate the normal distribution.
Author(s)
Jose Manuel Gomez Caceres, josemanuel.gomezc@edu.uah.es
Juan Jose Cuadrado, jjcg@uah.es
Universidad de Alcala de Henares
Examples
  ## Not run:
  interactive.normal()

## End(Not run)
User Interactive Pearson Correlation Calculus
Description
Interactive function for pearson correlation calculus.
Usage
interactive.pearson()
Details
The user provides the datasets when the function needs it. After that, the function will ask what is the correct result for this dataset. The function itself will provide the pearson correlation formule, apart from the pearson_ help document.
Value
An interactive process to calculate the pearson correlation.
Author(s)
Jose Manuel Gomez Caceres, josemanuel.gomezc@edu.uah.es
Juan Jose Cuadrado, jjcg@uah.es
Universidad de Alcala de Henares
Examples
  ## Not run:
  interactive.pearson()

## End(Not run)
User Interactive Percentile Calculus
Description
Interactive function for percentiles calculus.
Usage
interactive.percentile()
Details
The user provides the dataset when the function needs it. After that, the function will ask what is the correct result for this dataset. The function itself will provide the formula.
Value
An interactive process to calculate the percentiles
Author(s)
Dennis Monheimius, dennis.monhemimius@edu.uah.es
Eduardo Benito, eduardo.benito@edu.uah.es
Juan Jose Cuadrado, jjcg@uah.es
Universidad de Alcala de Henares
Examples
  ## Not run:
  interactive.percentile()

## End(Not run)
User Interactive Poisson Distribution Calculus
Description
Interactive function for Poisson distribution calculus.
Usage
interactive.poisson()
Details
The user provides the values when the function needs it. After that, the function will ask what is the correct result for this datas. The function itself will provide the Poisson distribution formule, apart from the poisson_ help document.
Value
An interactive process to calculate the Poisson distribution.
Author(s)
Jose Manuel Gomez Caceres, josemanuel.gomezc@edu.uah.es
Juan Jose Cuadrado, jjcg@uah.es
Universidad de Alcala de Henares
Examples
  ## Not run:
  interactive.poisson()

## End(Not run)
User Interactive Quartiles Calculus
Description
Interactive function for quartiles calculus.
Usage
interactive.quartile()
Details
The user provides the dataset when the function needs it. After that, the function will ask what is the correct result for this dataset. The function itself will provide the formula.
Value
An interactive process to calculate the quartiles
Author(s)
Dennis Monheimius, dennis.monhemimius@edu.uah.es
Eduardo Benito, eduardo.benito@edu.uah.es
Juan Jose Cuadrado, jjcg@uah.es
Universidad de Alcala de Henares
Examples
  ## Not run:
  interactive.quartile()

## End(Not run)
User Interactive Relative Accumulated Frecuency Calculus
Description
Interactive function for relative accumulated frecuency calculus.
Usage
interactive.relative_acum_frecuency()
Details
The user provides the dataset when the function needs it. After that, the function will ask what is the correct result for this dataset. The function itself will provide the formula.
Value
An interactive process to calculate the relative accumulated frecuency
Author(s)
Dennis Monheimius, dennis.monhemimius@edu.uah.es
Eduardo Benito, eduardo.benito@edu.uah.es
Juan Jose Cuadrado, jjcg@uah.es
Universidad de Alcala de Henares
Examples
  ## Not run:
  interactive.relative_acum_frecuency()

## End(Not run)
User Interactive Relative Frecuency Calculus
Description
Interactive function for relative frecuency calculus.
Usage
interactive.relative_frecuency()
Details
The user provides the dataset when the function needs it. After that, the function will ask what is the correct result for this dataset. The function itself will provide the formula.
Value
An interactive process to calculate the relative frecuency
Author(s)
Dennis Monheimius, dennis.monhemimius@edu.uah.es
Eduardo Benito, eduardo.benito@edu.uah.es
Juan Jose Cuadrado, jjcg@uah.es
Universidad de Alcala de Henares
Examples
  ## Not run:
  interactive.relative_frecuency()

## End(Not run)
User Interactive Standard Deviation Calculus
Description
Interactive function for standard deviation calculus.
Usage
interactive.standardDeviation()
Details
The user provides the dataset when the function needs it. After that, the function will ask what is the correct result for this dataset. The function itself will provide the standard deviation formule, apart from the standardDeviation_ help document.
Value
An interactive process to calculate the standard deviation
Author(s)
Dennis Monheimius, dennis.monhemimius@edu.uah.es
Eduardo Benito, eduardo.benito@edu.uah.es
References
https://en.wikipedia.org/wiki/Standard_deviation
Examples
   ## Not run:
  interactive.standardDeviation()

## End(Not run)
User Interactive T-Student Distribution Calculus
Description
Interactive function for T-Student distribution calculus.
Usage
interactive.tstudent()
Details
The user provides the values when the function needs it. After that, the function will ask what is the correct result for this datas. The function itself will provide the T-Students distribution formule, apart from the tstudent_ help document.
Value
An interactive process to calculate the T-Student distribution.
Author(s)
Jose Manuel Gomez Caceres, josemanuel.gomezc@edu.uah.es
Juan Jose Cuadrado, jjcg@uah.es
Universidad de Alcala de Henares
Examples
  ## Not run:
  interactive.tstudent()

## End(Not run)
User Interactive Variance Calculus
Description
Interactive function for variance calculus.
Usage
interactive.variance()
Details
The user provides the dataset when the function needs it. After that, the function will ask what is the correct result for this dataset. The function itself will provide the variance formule, apart from the variance_ help document.
Value
An interactive process to calculate the average absolute deviation
Author(s)
Dennis Monheimius, dennis.monhemimius@edu.uah.es
Eduardo Benito, eduardo.benito@edu.uah.es
Juan Jose Cuadrado, jjcg@uah.es
Universidad de Alcala de Henares
Examples
  ## Not run:
  interactive.variance()

## End(Not run)
Laplace's Rule Calculus Function
Description
This function calculates the Laplace's rule of experiment.
Usage
laplace_(x,y)
Arguments
x |
Should be a vector |
y |
Should be a vector |
Details
To calculate the Laplace's rule, the user should give two vector (unfavorable cases/favorable cases). The result isas the quotient between the number of favorable cases to A, and that of all possible results of the experiment. The Laplace's rule formule is the following:
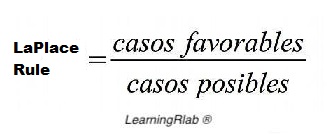
Value
Numeric, the pearson correlation.
Note
A vector is created by c(), like c(1,2,3,4,5) creates a vector with the numbers: 1,2,3,4,5
Author(s)
Jose Manuel Gomez Caceres, josemanuel.gomezc@edu.uah.es
Juan Jose Cuadrado, jjcg@uah.es
Universidad de Alcala de Henares
Examples
    #data creation
    data = 3
    data2 = c(1,2,3,4,5,6)
    laplace_(data, data2)
Mean Function Developed in C
Description
This function calculates the arithmetic mean of a numbers vector.
Usage
meanC(x)
Arguments
x |
Should be a numbers vector |
Details
To calculate the arithmetic mean of a dataset, the user should give a numbers vector. The result is the addition of all vector elements divided by the number of elements. The arithmetic mean formule is the following: 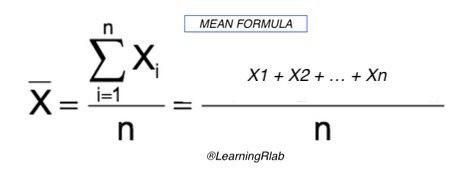
Value
A numeric, the arithmetic mean of the numbers vector.
Note
A vector is created by c(), like c(1,2,3,4,5) creates a vector with the numbers: 1,2,3,4,5
Author(s)
Dennis Monheimius, dennis.monhemimius@edu.uah.es
Eduardo Benito, eduardo.benito@edu.uah.es
Juan Jose Cuadrado, jjcg@uah.es
Universidad de Alcala de Henares
Examples
  #data creation
  vector = c(1:10)
  meanC(vector)
Mean Calculus Function
Description
This function calculates the arithmetic mean of a numbers vector.
Usage
mean_(x)
Arguments
x |
Should be a numbers vector |
Details
To calculate the arithmetic mean of a dataset, the user should give a numbers vector. The result is the addition of all vector elements divided by the number of elements. The arithmetic mean formule is the following:
Value
A numeric, the arithmetic mean of the numbers vector.
Note
A vector is created by c(), like c(1,2,3,4,5) creates a vector with the numbers: 1,2,3,4,5
Author(s)
Dennis Monheimius, dennis.monhemimius@edu.uah.es
Eduardo Benito, eduardo.benito@edu.uah.es
Juan Jose Cuadrado, jjcg@uah.es
Universidad de Alcala de Henares
Examples
vector <- c(2,4,6,8,10,12,14,16,18)
result = mean_(vector)
result
Median Calculus Function
Description
This function calculates the median of a numbers vector.
Usage
median_(x)
Arguments
x |
Should be a numbers vector |
Details
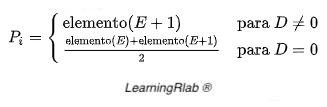
To calculate the median, the user should give a numbers vector. The result is the value separating the higher half from the lower half of the dataset, it may be thought of as the middle value. The median formule is the following:
Value
A numeric, the median of the numbers vector.
Note
A vector is created by c(), like c(1,2,3,4,5) creates a vector with the numbers: 1,2,3,4,5
Author(s)
Dennis Monheimius, dennis.monhemimius@edu.uah.es
Eduardo Benito, eduardo.benito@edu.uah.es
Juan Jose Cuadrado, jjcg@uah.es
Universidad de Alcala de Henares
Examples
{

result = median_(c(1,3,2,5,12,4,4,2,9))
result
}
Mode Calculus Function
Description
This function calculates the mode of a numbers vector.
Usage
mode_(x)
Arguments
x |
Should be a numbers vector |
Details
To calculate the mode of a dataset, the user should give a numbers vector. The result is the numeric value that appears most often. In other words, it's the value that is most likely to be sampled. The mode formule is the following:
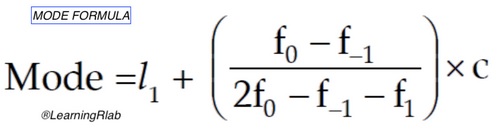
Value
Numeric, the mode of the numbers vector.
Note
A vector is created by c(), like c(1,2,3,4,5) creates a vector with the numbers: 1,2,3,4,5
Author(s)
Dennis Monheimius, dennis.monhemimius@edu.uah.es
Eduardo Benito, eduardo.benito@edu.uah.es
Juan Jose Cuadrado, jjcg@uah.es
Universidad de Alcala de Henares
Examples
{

    #data creation
    data = c(1,2,2,3,4)

    mode_(data)

}
Normal Distribution Calculus Function
Description
This function calculates the normal distribution of experiment.
Usage
normal_(x)
Arguments
x |
Should be a numbers. |
Details
To calculate the normal distribution, the user should give a number. The result isis a type of continuous probability distribution for a real-valued random variable. The normal distribution formule is the following:
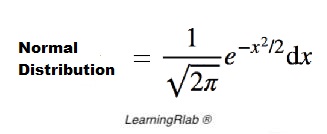
Value
Numeric, the normal distribution.
Note
The variable is a number. Example: x <- 0.1
Author(s)
Jose Manuel Gomez Caceres, josemanuel.gomezc@edu.uah.es
Juan Jose Cuadrado, jjcg@uah.es
Universidad de Alcala de Henares
Examples
    #data creation
    x = 0.1

    normal_(x)
Pearson Correlation Calculus Function
Description
This function calculates the pearson correlation of two vectors of numbers.
Usage
pearson_(x,y)
Arguments
x |
Should be a vector |
y |
Should be a vector |
Details
To calculate the pearson correlation, the user should give two vectors of numbers. The result is the covariance of the two vectors of numbers divided by the product of their standard deviations. The pearson correlation formule is the following:
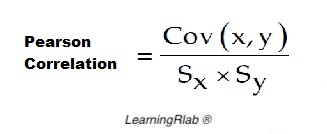
Value
Numeric, the pearson correlation of two vectors of numbers.
Note
A vector is created by c(), like c(1,2,3,4,5) creates a vector with the numbers: 1,2,3,4,5
Author(s)
Jose Manuel Gomez Caceres, josemanuel.gomezc@edu.uah.es
Juan Jose Cuadrado, jjcg@uah.es
Universidad de Alcala de Henares
Examples
    #data creation
    data = c(1,4,3,3,2,5,7,12,1,2,3,12)
    data2 = c(1,2,4,4,6,5,11,2,10,5,6,1)
    pearson_(data, data2)
Percentile Calculus Function
Description
This function calculate the percentiles of a vector of numbers
Usage
percentile_(x, p)
Arguments
x |
Should be a vector |
p |
Should be a number, 0 => y =< 1 |
Details
To calculate the percentiles, the user should give a vector. This function divide the dataset in 100 parts as equal as possible. The formula is the following:
Value
A vector sorted with the elements divided by 100 parts
Note
A vector is created by c(), like c(1,2,3,4,5) creates a vector with the numbers: 1,2,3,4,5
Author(s)
Dennis Monheimius, dennis.monhemimius@edu.uah.es
Eduardo Benito, eduardo.benito@edu.uah.es
Juan Jose Cuadrado, jjcg@uah.es
Universidad de Alcala de Henares
Examples
{
    #data creation
    data = c(1,4,3,3,2,5,7,12,1,2,3,12)

    percentile_(data,0.3)

}
Poisson Distribution Calculus Function
Description
This function calculates the Poisson distribution of experiment.
Usage
poisson_(k,lam)
Arguments
k |
Should be a numbers |
lam |
Should be a numbers |
Details
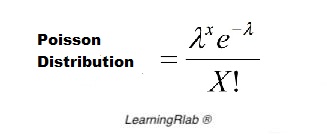
To calculate the Poisson distribution, the user should give two number ( the number of times the phenomenon and the number of occurrences). The result is a discrete probability distribution that expresses, from a mean frequency of occurrence, the probability that a certain number of events will occur during a certain period of time. The Poisson distribution formule is the following:
Value
Numeric, the pearson correlation of two numbers.
Note
Each variable is a number. Example: lam <- 2 | k <- 3
Author(s)
Jose Manuel Gomez Caceres, josemanuel.gomezc@edu.uah.es
Juan Jose Cuadrado, jjcg@uah.es
Universidad de Alcala de Henares
Examples
    #data creation
    lam = 2
    k = 3
    poisson_(k,lam)
Quartiles Calculus
Description
Calculates the 3 Quartiles of a vector of data
Usage
quartile_(x)
Arguments
x |
Should be a vector |
Details
To calculate the quartiles, the user should give a vector. This function divide the dataset in 4 parts as equal as possible. The formula is the following:

Value
A vector sorted with the elements divided by 4 parts
Note
A vector is created by c(), like c(1,2,3,4,5) creates a vector with the numbers: 1,2,3,4,5
Author(s)
Dennis Monheimius, dennis.monhemimius@edu.uah.es
Eduardo Benito, eduardo.benito@edu.uah.es
Juan Jose Cuadrado, jjcg@uah.es
Universidad de Alcala de Henares
Examples
{
    #data creation
    data = c(1:20)

    quartile_(data)

    }
Standard Deviation Calculus Function
Description
This function calculates the standard deviation of a numbers vector.
Usage
standardDeviation_(x)
Arguments
x |
Should be a numbers vector |
Details
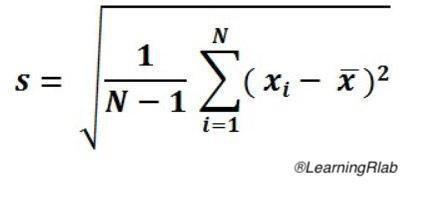
To calculate the standard deviation, the user should give a numbers vector. The result is the square root of the sum of the differences between each vector element and the mean squared divided by the number of elemets. The standard deviation formule is the following:
Value
Numeric, the standard deviation of the numbers vector.
Note
A vector is created by c(), like c(1,2,3,4,5) creates a vector with the numbers: 1,2,3,4,5
Author(s)
Dennis Monheimius, dennis.monhemimius@edu.uah.es
Eduardo Benito, eduardo.benito@edu.uah.es
Juan Jose Cuadrado, jjcg@uah.es
Universidad de Alcala de Henares
Examples
    #data creation
    data = c(1,4,3,3,2,5,7,12,1,2,3,12)

    standardDeviation_(data)
T-Student Distribution Calculus Function
Description
This function calculates the T-Student distribution of experiment.
Usage
tstudent_(x,u,s,n)
Arguments
x |
Should be a number |
u |
Should be a number |
s |
Should be a number |
n |
Should be a number |
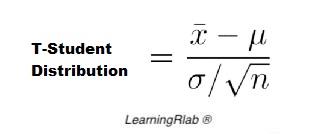
Details
To calculate the T-Student distribution, the user should give four number (sample mean, population mean, population standard deviation and sample size). The result is a probability distribution that arises from the problem of estimating the mean of a normally distributed population when the sample size is small. The T-Student distributionformule is the following:
Value
Numeric, the T-Student distribution.
Note
Each variable is a number. Example: x <- 2 | y <- 4
Author(s)
Jose Manuel Gomez Caceres, josemanuel.gomezc@edu.uah.es
Juan Jose Cuadrado, jjcg@uah.es
Universidad de Alcala de Henares
Examples
    #data creation
    x = 52.9
    u = 50
    s = 3
    n = 10

    tstudent_(x,u,s,n)
Variance Calculus Function
Description
This function calculates the variance of a numbers vector.
Usage
variance_(x)
Arguments
x |
Should be a numbers vector |
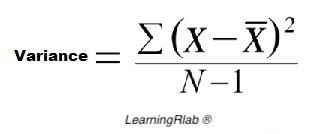
Details
To calculate the variance, the user should give a numbers vector. The result is the expectation of the squared deviation of all numbers vector from its mean. The variance formule is the following:
Value
Numeric, the variance of the numbers vector.
Note
A vector is created by c(), like c(1,2,3,4,5) creates a vector with the numbers: 1,2,3,4,5
Author(s)
Dennis Monheimius, dennis.monhemimius@edu.uah.es
Eduardo Benito, eduardo.benito@edu.uah.es
Juan Jose Cuadrado, jjcg@uah.es
Universidad de Alcala de Henares
Examples
    #data creation
    data = c(1,4,3,3,2,5,7,12,1,2,3,12)

    variance_(data)