| Type: | Package |
| Title: | Statistical Analysis of Amplicon Data of the Same Sample to Identify Artefacts |
| Version: | 1.1.1 |
| Date: | 2020-05-22 |
| Author: | Anja Lange [aut, cre], Daniel Hoffmann [aut] |
| Maintainer: | Anja Lange <anja.lange@uni-due.de> |
| Depends: | R (≥ 2.10), stats, ggplot2, xtable |
| Description: | Increasingly powerful techniques for high-throughput sequencing open the possibility to comprehensively characterize microbial communities, including rare species. However, a still unresolved issue are the substantial error rates in the experimental process generating these sequences. To overcome these limitations we propose an approach, where each sample is split and the same amplification and sequencing protocol is applied to both halves. This procedure should allow to detect likely PCR and sequencing artifacts, and true rare species by comparison of the results of both parts. The AmpliconDuo package, whereas amplicon duo from here on refers to the two amplicon data sets of a split sample, is intended to help interpret the obtained read frequency distribution across split samples, and to filter the false positive reads. |
| License: | GPL (≥ 3) |
| NeedsCompilation: | no |
| Packaged: | 2020-05-25 10:31:28 UTC; anja |
| Repository: | CRAN |
| Date/Publication: | 2020-05-25 22:20:02 UTC |
Statistical Analysis Of Amplicon Data Of The Same Sample To Identify Spurious Amplicons
Description
Increasingly powerful techniques for high-throughput sequencing open the possibility to comprehensively characterize microbial communities, including rare species. However, a still unresolved issue are the substantial error rates in the experimental process generating these sequences. To overcome these limitations we propose an approach, where each sample is split and the same amplification and sequencing protocol is applied to both halves. This procedure should allow to detect likely PCR and sequencing artifacts, and true rare species by comparison of the results of both parts.
The AmpliconDuo package, whereas ampliconduo from here on refers to the two amplicon data sets of a split sample, is intended to help interpret the obtained amplicon frequency distribution across split samples, and to filter the false positive amplicons.
Details
| Package: | AmpliconDuo |
| Type: | Package |
| Version: | 1.1.1 |
| Date: | 2020-05-22 |
| License: | GPL-2 |
The core of this package is the ampliconduo function, that generates for each pair of a split samples an ampliconduo data frame, while statistically analysing the data by Fisher's exact test.
Ampliconduo data frames, or lists of these, are the input required for all other functions of this package.
plotAmpliconduoplots for an ampliconduo the amplicon frequencies (number of reads per amplicon) of sample A vs. amplicon frequencies of sample B, highlighting amplicons displaying a significant deviation between both samples.plotAmpliconduo.setdoes the same asplotAmpliconduobut accepts a list of ampliconduo data frames and arranges the plots in a 2-dimensional array.plotORdensitygenerates a histogram plot of the amplicon frequency odds ratio density for an ampliconduo data frame. For multiple data frames organizes the plots in a 2-dimentional array.discordance.deltacalculates delta (\Delta) and delta prime (\Delta'), the fraction of amplicon frequencies and amplicons, respectively, with a false discovery rate below a certain threshold\thetaas a measure of discordance between two amplicon data sets A and B.filter.ampliconduoapplies filter criteria to an ampliconduo data frame deciding which amplicons are going to be rejected.filter.ampliconduo.setsame asfilter.ampliconduofor a list af ampliconduo data frames.accepted.ampliconsreturns the indices of those amplicons that have passed the filter criteria.
Author(s)
Anja Lange (anja.lange@uni-due.de) and Daniel Hoffmann (daniel.hoffmann@uni-due.de)
Maintainer: Anja Lange (anja.lange@uni-due.de)
References
Lange A, Jost S, Heider D, Bock C, Budeus B, et al. (2015) AmpliconDuo: A Split-Sample Filtering Protocol for High-Throughput Amplicon Sequencing of Microbial Communities. PLOS ONE 10(11): e0141590
Examples
## load test amplicon frequency data ampliconfreqs and vector with sample names site.f
data(ampliconfreqs)
data(site.f)

## generating ampliconduo data frames
## depending on the size if the data sets, may take some time
ampliconduoset <- ampliconduo(ampliconfreqs[,1:4], sample.names = site.f[1:2])

## plot amplicon read numbers of sample A  vs. amplicon read numbers of sample B,
## indicating amplicons with significant deviations in their occurence across samples
plotAmpliconduo.set(ampliconduoset, nrow = 3)

## calculate discordance between the two data sets of an ampliconduo
discordance <- discordance.delta(ampliconduoset)

## plot the odds ratio density of ampliconduo data
plotORdensity(ampliconduoset)

## apply filter criteria to remove/mark spurious amplicons
ampliconduoset.f <- filter.ampliconduo.set(ampliconduoset, min.freq = 1, q = 0.05)

## return indices of accepted amplicons, indices correspond to indices of the ampliconfreqs data,
## that were used as input for the ampliconduo function
accep.reads <- accepted.amplicons(ampliconduoset.f)
List Of Amplicon Indices That Passed Filter Criteria
Description
Returns the indices of those amplicons in an ampliconduo data frame, that passed the applied filter criteria (ampliconduo data frames are filtered using the filter.ampliconduo or filter.ampliconduo.set function).
Usage
accepted.amplicons(x)
Arguments
x |
An ampliconduo data frame or a list of ampliconduo data frames. |
Details
Calling this function on an ampliconduo data frame, or a list of the latter, returns the indices of amplicons that passed the applied filter criteria. For each ampliconduo data frame an integer vector is created, and if a list of ampliconduo data frames is supplied with x, these are pooled in a list.
The returned indices correspond to the data originally used to generate the ampliconduo data frames (parameter A and B in the ampliconduo function call).
Value
If x is an ampliconduo data frame, an integer vector is returned.
In case x is a list of ampliconduo data frames, a list of integer
vectors is returned, one for each data frame.
Author(s)
Anja Lange & Daniel Hoffmann
See Also
filter.ampliconduo and filter.ampliconduo.set
Examples
## load example data
data(amplicons)

## apply filter criteria
ampliconduos.f <- filter.ampliconduo.set(amplicons, q = 0.05)

## return a list with accepted amplicons
good.reads <- accepted.amplicons(ampliconduos.f)
Apply Fisher's Exact Tests To Two Amplicon Frequency Sets Of The Same Sample
Description
Implements Fisher's exact test to detect amplicons with significant deviating read numbers between two amplicon sets of the same sample. The p-values of the Fisher's exact test are corrected for multiple testing by computation of the false discovery rates q. This function is intended to help identifying reads that may be the results of experimental artefacts. (The calculation can take some time depending on the size of the data sets and the computing power.)
Usage
ampliconduo(A, B = NULL, sample.names = NULL, correction = "fdr", ...)
Arguments
A |
A list or a data frame containing amplicon occurences / number of reads per amplicon (integer values). |
B |
Optional. A list or a data frame containing amplicon occurences. |
sample.names |
Optional. A vector or list of characters with names for the amplicon pairs. |
correction |
Optional. Specifies the correction method for the p-values from Fisher's exact test.
Accepts one of the following characters: |
... |
Arguments passed to the internally called |
Details
If only A is specified, it is assumed that the list elements 1 &
2, 3 & 4 etc. of A are amplicon data of the same sample. In case A and B
are specified, the ith frequency set of A and B
are combined. For each amplicon data pair, frequencies at the corresponding
positions in the lists are assumed to belong to the same amplicon. It is required, that two frequency sets that belong to the same sample, an ampliconduo, have the same length. The ampliconduo function iterates over all amplicon pairs and performs the following tasks:
-
amplicons with frequency zero in both samples are removed. Position information is retained.
-
For each amplicon Fisher's exact test using the method
fisher.testis performed. The p-value, odds ratio and confidence interval are returned. Via the..., argumentsconf.level,orandalternativecan be passed to thefisher.testfunction call. Default values areconf.level= 0.95,or= 1 andalternative= "two.sided". -
The p-values are corrected using the
p.adjustfunction. By default the method by Benjamini & Hochberg (1995) is used. Setting thecorrectionargument to any of the following characters"holm", "hochberg", "hommel", "bonferroni", "BH", "BY", "fdr", "none", the adjustment method for the p-values can be changed. See functionp.adjust.
The AmpliconDuo package implements further methods to visualize and filter the returned ampliconduo data frames.
Value
A list of data frames, one for each amplicon pair, that will be called ampliconduo data frame in the following. List entries are named according to the specified sample.names or numbered.
Each ampliconduo data frame has 9 columns
-
freqA: frequencies of amplicon set A
-
freqB: frequencies of amplicon set B (taken from argument
Bif specified) -
p: p-values calculated with Fisher's exact test
-
OR: odds ratio calculated with Fisher's exact test
-
CI.low: lower confidence limit for
OR -
CI.up: upper confidence limit for
OR -
rejected: logical, indicating whether the amplicon was rejected
-
sample: sample name taken from
sample.nameif specified, same for all rows in a given data frame
Author(s)
Anja Lange and Daniel Hoffmann
References
Y Benjamini and Y Hochberg. Controlling the False Discovery Rate: A Practical and Powerful Approach to Multiple Testing. Journal of the Royal Statistical Society. Series B (Methodological), 57(1):289-300, 1995.
See Also
fisher.test, used to calculate the p-value, odds ratio and confidence interval;
p.adjust, called to correct the p-values;
methods to visualize or further manipulate the ampliconduo data frames:
plotAmpliconduo.set,
plotAmpliconduo,
discordance.delta,
Examples
## loads read numbers from example amplicon data sets
data(ampliconfreqs)
data(site.f)

## generate ampliconduo data frames
ampliconduos.a <- ampliconduo(A = ampliconfreqs[,1:4], sample.names = site.f[1:2])
ampliconduos.b <- ampliconduo(A = ampliconfreqs[c(1,3)],
B = ampliconfreqs[c(2,4)], sample.names = site.f[1:2],
conf.level = 0.9)

## frequency plot
plotAmpliconduo.set(ampliconduos.a)
SSU Amplicon Frequencies Of Different Sampling Sites (Short Version)
Description
A data frame with 16 amplicon data sets taken from 8 different sampling sites. A reduced version (frequencies of 2500 amplicons) of the ampliconfreqs.long data provided with this package.
Samples from each sampling site were sequenced twice, corresponding to sets A and B (e.g. column FU25.A and FU25.B).
Names of the sampling sites are specified in the data site.f.
Usage
data(ampliconfreqs)Format
A data frame with 80903 observations on the following 16 variables.
FU25.Aa numeric vector
FU25.Ba numeric vector
FU28.Aa numeric vector
FU28.Ba numeric vector
FU31.Aa numeric vector
FU31.Ba numeric vector
FU31.Ca numeric vector
FU31.Da numeric vector
FU34.Aa numeric vector
FU34.Ba numeric vector
FU37.Aa numeric vector
FU37.Ba numeric vector
UniPond.Aa numeric vector
UniPond.Ba numeric vector
BogSoil.Aa numeric vector
BogSoil.Ba numeric vector
References
Boenigk J, Heider D, Jost S, Lange A, Budeus B, Schilling E, Strittmatter A, Hoffmann D: A high-throughput amplicon sequencing and analysis protocol for comparative analyses of microbial communities (submitted)
Examples
data(ampliconfreqs)
data(site.f)
ampliconduo.a <- ampliconduo(ampliconfreqs[,1:4], sample.names = site.f[1:2])
SSU Amplicon Frequencies Of Different Sampling Sites
Description
A data frame with 16 amplicon data sets taken from 8 different sampling sites.
Samples from each sampling site were sequenced twice, corresponding to sets A and B (e.g. column FU25.A and FU25.B).
Names of the sampling sites are specified in the data site.f.
Usage
data(ampliconfreqs.long)Format
A data frame with 80903 observations on the following 16 variables.
FU25.Aa numeric vector
FU25.Ba numeric vector
FU28.Aa numeric vector
FU28.Ba numeric vector
FU31.Aa numeric vector
FU31.Ba numeric vector
FU31.Ca numeric vector
FU31.Da numeric vector
FU34.Aa numeric vector
FU34.Ba numeric vector
FU37.Aa numeric vector
FU37.Ba numeric vector
UniPond.Aa numeric vector
UniPond.Ba numeric vector
BogSoil.Aa numeric vector
BogSoil.Ba numeric vector
References
Boenigk J, Heider D, Jost S, Lange A, Budeus B, Schilling E, Strittmatter A, Hoffmann D: A high-throughput amplicon sequencing and analysis protocol for comparative analyses of microbial communities (submitted)
Example List of Ampliconduo Data Frames
Description
A list of ampliconduo data frames that was generated calling the
ampliconduo function with its default parameters and the
ampliconfreqs.long data provided with this package as input.
Usage
data(amplicons)References
Boenigk J, Heider D, Jost S, Lange A, Budeus B, Schilling E, Strittmatter A, Hoffmann D: A high-throughput amplicon sequencing and analysis protocol for comparative analyses of microbial communities (submitted)
Examples
data(amplicons)
plotAmpliconduo.set(amplicons, nrow = 3)
Measure Of Discordance Between Two Amplicon Data Sets
Description
Calculates delta (\Delta) and delta prime (\Delta'), the fraction of amplicon frequencies and amplicons, respectively, with a false discovery rate below a certain threshold \theta as a measure of discordance between two amplicon data sets A and B.
Usage
discordance.delta(x, names = NULL, theta = 0.05, corrected = TRUE,
printToTex = FALSE, directory = NULL, file.name = NULL)
Arguments
x |
A list of amplicon duo data frames as returned by the |
names |
Optional. Vector or list of characters specifying the sample/amplicon pair names. By default
names are taken from the element names of |
theta |
Optional. Numeric, threshold for the false discovery rate. Default value is 0.05. |
corrected |
Optional. Logical, indicates whether the p-value from Fisher's exact test (FALSE) or the
adjusted p-value (TRUE), here called q, is used for calculation of |
printToTex |
Optional. Logical, if |
directory |
Optional. If |
file.name |
Optional. If |
Details
Calculates \Delta and \Delta', the fraction of frequencies of amplicons and amplicons, respectively, with false discovery rate below a certain threshold \theta as a measure of discordance between two amplicon data sets A and B with occurence r_{(iAS)} of amplicon i in amplicon set A of sample S (the ampliconduo data frame).
\Delta and \Delta' are defined as follows:
\Delta_{S\theta} = \frac{\sum_{i=1}^{n_S}(r_{iAS}+r_{iBS})\delta(q_{iS}<\theta)}{\sum_{i=1}^{n_S}(r_{iAS}+r_{iBS})}\\
\Delta'_{S\theta} = \frac{\sum_{i=1}^{n_S}\delta(q_{iS}<\theta)}{n_S},\\
  \mathrm{with\;} \delta(q_{iS}<\theta) =
  \left\{
  \begin{array}{cc}
  1 & \mathrm{\;for\;} q_{iS} < \theta\\
  0 & \mathrm{\;for\;} q_{iS} \ge \theta
  \end{array}
  \right.
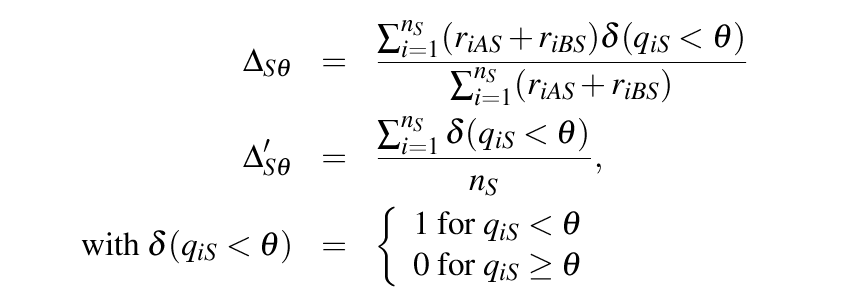
for number n_S of amplicons detected in sample/ampliconduo S. \Delta_{S\theta} and \Delta'_{S\theta} are located between 0 (no discordance, i.e. no statistically significant deviations between experimental branches) and 1 (complete discordance).
x is the return value of a ampliconduo call.
Value
Data frame with three columns. The first column contains the sample/amplicon pair names. Second and third column
harbor the corresponding \Delta and \Delta' values, respectively.
Author(s)
Anja Lange & Daniel Hoffmann
See Also
ampliconduo, generates the expected data format for x
xtable, used to convert the returned data frame into a Latex table.
Examples
## load example ampliconduo data frame
data(amplicons)

## calculate the discordance between amplicon data sets of an ampliconduo data frame
dd.a <- discordance.delta(amplicons)
dd.b <- discordance.delta(amplicons, theta = 0.1)
AmpliconDuo Amplicon Filter
Description
Marks or removes amplicons from an ampliconduo data frame according to the specified filter criteria.
Usage
filter.ampliconduo(x, min.freq = 1, OR = NULL, q = NULL, p = NULL, remove = FALSE)
Arguments
x |
Data frame, an ampliconduo data frame returned by the |
min.freq |
Optional. Integer, minimium frequency/read count for an amplicon in each of the two amplicon sets to be retained. Default value is 1. |
OR |
Optional. Numeric, minimum odds ratio for an amplicon to be retained. If no value is specified the odds ratio is excluded from the filter criteria. |
q |
Optional. Numeric, minimum value for |
p |
Optional. Numeric, minimum p-value for an amplicon to pass the filter. If no value for |
remove |
Optional. Logical, decides whether amplicons that fail the filter criteria should be removed ( |
Details
Takes the ampliconduo data frame x and applies each filter criterion that is selected to each amplicon.
If an amplicon i does not pass each of the applied criteria, the logical value in column rejected in row i is set to TRUE.
In case the parameter remove was set to TRUE, all amplicons with rejected = TRUE are removed. The position information with respect to the data used as input for the ampliconduo call is retained.
Value
Data frame corresponding to the input x, but with the adjustments in the rejected column according to the specified filter criteria, or removed rows (removed = TRUE).
Author(s)
Anja Lange & Daniel Hoffmann
See Also
ampliconduo, generates the input data x for this method.
accepted.amplicons, returns the indices of amplicons that
have passed the filter criteria.
Examples
##load example data
data(amplicons)

## extract the first ampliconduo data frame
ampliconduo1 <- amplicons[[1]]

## apply filter criteria
ampliconduo1.f <- filter.ampliconduo(ampliconduo1)
ampliconduo1.f <- filter.ampliconduo(ampliconduo1, min.freq = 2, remove = TRUE)

## to return a list with the indices (corresponding to the indices of the data
## the ampliconduo function was called on) of all amplicons that passed the filter criteria
good.reads <- accepted.amplicons(ampliconduo1.f)
AmpliconDuo List Amplicon Filter
Description
Marks or removes amplicons from each ampliconduo data frame in a list according to the specified filter criteria.
Usage
filter.ampliconduo.set(x, min.freq = 1, OR = NULL, q = NULL, p = NULL, remove = FALSE)
Arguments
x |
List of ampliconduo data frames, return value of an |
min.freq |
Optional. Integer, minimium frequency/read count for a given amplicon in each of the two amplicon sets of an ampliconduo to be retained. Default value is 1. |
OR |
Optional. Numeric, minimum odds ratio for an amplicon to be retained. If no value is specified the odds ratio is excluded from the filter criteria. |
q |
Optional. Numeric, minimum value for |
p |
Optional. Numeric, minimum p-value for an amplicon to pass the filter.
If no value for |
remove |
Optional. Logical, decides whether amplicons that fail the filter criteria should be removed ( |
Details
For every ampliconduo data frame in argument x, applies
each filter criterion that was specified to each amplicon.
If an amplicon i fails any of the applied criteria, the logical value in column rejected in row i is set to TRUE.
In case the parameter remove was set to TRUE, all amplicons with rejected = TRUE are removed. The position information in respect to the data used as input for the ampliconduo call are kept.
This method uses the function filter.ampliconduo.
Value
List of ampliconduo data frames. Same as input parameter x but with the adjustments in the rejected column according to the specified filter criteria, or removed rows (removed = TRUE)
Author(s)
Anja Lange & Daniel Hoffmann
See Also
filter.ampliconduo, performs filtering on single ampliconduo data.frames, is called by this method.
ampliconduo, generates the input data x for this method.
accepted.amplicons, returns the indices of amplicons that
have passed the filter criteria.
Examples
## load example data
data(amplicons)

## apply filter criteria
ampliconduos.f <- filter.ampliconduo.set(amplicons)
ampliconduos.f <- filter.ampliconduo.set(amplicons, min.freq = 3, remove = TRUE)

## to return a list with the indices (corresponding to the indices of the data
## the ampliconduo function was called on) of all amplicons that passed the filter criteria
good.reads <- accepted.amplicons(ampliconduos.f)
Frequeny-Frequency Plot Focusing On Significant Deviations In Amplicon Occurences
Description
Applied to an ampliconduo data frame, one element of the return value of
the ampliconduo function. Generates a plot of freqB
over freqA (the read numbers of the same amplicon in both halves
A and B of a split sample). For amplicons that have significantly
deviating read numbers, i.e. with a p-value or adjusted p-value below a
certain treshold, points are colored differently (default: red).
Usage
plotAmpliconduo(x, color.treshold = 0.05, xlab = "Abundance (PCR A)",
ylab = "Abundance (PCR B)",main = NULL, log = "xy", corrected = TRUE, asp = 1,
legend.position = NULL, save = FALSE, path = NULL, file.name = NULL,
format = "jpeg", h.start = 0, ...)
Arguments
x |
Ampliconduo data frame, an element of the returned list of the |
color.treshold |
Optional. Numeric value specifying at which p-value or adjusted p-value points in the plot are drawn in complementary color. Default value is 0.05. |
xlab |
Optional. Character indicating the x-axis label. Default is “Abundance (PCR A)”. |
ylab |
Optional. Character indicating the y-axis label. Default is “Abundance (PCR B)”. |
main |
Optional. Character specifying the overall title of the plot. If no value is passed, takes the
sample name from the |
log |
Optional. Character specifying the variables to transform to log (“”,“x”, “y”, or “xy”). Default is “xy”. |
corrected |
Optional. Logical to decide whether the p-value ( |
asp |
Optional. Numeric value, the y/x aspect ratio. Default is 1. |
legend.position |
Optional. Numeric vector of length two. Defines the position of the legend. By default tries to find a position that fits best the arrangement of the plots. |
save |
Optional. Logical value indicationg if the plot should be saved to file. Default value is |
path |
Optional. Character, in case the argument |
file.name |
Optional. If argument |
format |
Optional. Character specifying the format of the saved file. One of “eps”, “ps”, “tex”, “pdf”, “jpeg”, “tiff”, “png”, “bmp”, “svg” and “wmf” (windows only). Default format is “jpeg”. |
h.start |
Optional. Numeric value between 0 and 360 defines the color of the plotted points. Default value is 0 (blue-green, red). |
... |
Optional. Allows to pass other aesthetics. |
Author(s)
Anja Lange & Daniel Hoffmann
References
https://ggplot2.tidyverse.org/reference/qplot.html
See Also
ggplot2 package
qplot internally used to create the plot.
plotAmpliconduo.set, generates a very similar plot for a list of ampliconduo data frames.
ampliconduo, generates the input data.
Examples
## load example data
data(amplicons)

## extract the second ampliconduo data frame
ampliconduo2 <- amplicons[[2]]

## plot the amplicon frequencies of the ampliconduo data frame
plotAmpliconduo(ampliconduo2, main = "ampliconduo_2")
plotAmpliconduo(ampliconduo2, main = "ampliconduo_2", h.start = 50, log = "")
plotAmpliconduo(ampliconduo2, h.start = 50, log = "", asp = 2, corrected = FALSE)
Frequeny-Frequency Plot Arrangement Focusing On Significant Deviations In Amplicon Occurences
Description
Called on the return value of the ampliconduo function, a list of ampliconduo data frames. Generates for each ampliconduo data frame a plot with freqB over freqA and arranges them in a 2-dimensional array, whereas plots in the same row and column share the same scale. Points with a p-value or adjusted p-value below a certain treshold are colored differently (default: red) indicating significant deviations of amplicon occurences between the two samples in an ampliconduo data frame.
Usage
plotAmpliconduo.set(x, color.treshold = 0.05, xlab = "Abundance (PCR A)",
ylab = "Abundance (PCR B)",log = "xy", corrected = TRUE, asp = 1, nrow = 1,
legend.position = NULL, save = FALSE, path = NULL, file.name = NULL,
format = "jpeg", h.start = 0, ...)
Arguments
x |
List of ampliconduo data frames, return value of the |
color.treshold |
Optional. Numeric value specifying at which p-value or adjusted p-value points in the plot are drawn in complementary color. Default value is 0.05. |
xlab |
Optional. Character indicating the x-axis label. Default is “Abundance (PCR A)”. |
ylab |
Optional. Character indicating the y-axis label. Default is “Abundance (PCR B)”. |
log |
Optional. Character specifying the variables to transform to log (“”,“x”, “y”, or “xy”). Default is “xy”. |
corrected |
Optional. Logical to decide whether the p-value ( |
asp |
Optional. Numeric value, the y/x aspect ratio. Default is 1. |
nrow |
Optional. Integer value specifying the numer of rows used to arrange the plots. Default is 1. |
legend.position |
Optional. Numeric vector of length two. Defines the position of the legend. By default tries to find a position that fits the arrangement of the plots best. |
save |
Optional. Logical value indicationg if the plot should be saved to file. Default value is |
path |
Optional. Character, in case the argument |
file.name |
Optional. If argument |
format |
Optional. Character specifying the format of the saved file. One of “eps”, “ps”, “tex”, “pdf”, “jpeg”, “tiff”, “png”, “bmp”, “svg” and “wmf” (windows only). Default format is “jpeg”. |
h.start |
Optional. Numeric value between 0 and 360, defines the color of the plotted points. Default value is 0 (blue-green, red). |
... |
Optional. Allows to pass other aesthetics. |
Details
Generates an arrangement of plots from the return value of the ampliconduo function, that nicely visualizes those amplicons with a significant deviations in read numbers between the two amplicon data sets. The data in x are transformed and passed to the qplot function. The 2-dimensional arrangement of the different plots is achieved using facet_wrap. Important aestetic parameters like color, aspect ratio, legend position ... are easily customized. Optionally, the plot can be saved in a variety of formats.
Author(s)
Anja Lange & Daniel Hoffmann
References
https://ggplot2.tidyverse.org/reference/qplot.html
See Also
ggplot2 package
qplot, used by plotAmpliconduo.set to create the plots.
facet_wrap, called for 2-dimensional arrangement of the plots.
plotAmpliconduo, generates a very similar plot for a single ampliconduo data frame.
ampliconduo, generates the input data, an ampliconduo data frame.
Examples
## loads example data of ampliconduo data frames
data(amplicons)

## plot amplicon frequencies of multiple ampliconduo data frames
plotAmpliconduo.set(amplicons[1:4], nrow = 3, h.start = 100)

plotAmpliconduo.set(amplicons[1:4], nrow = 1, corrected = FALSE, color.treshold = 0.1)
Probability Density Plot Of Odds Ratios
Description
Plots for an ampliconduo data frame probability densities of the odds ratios of amplicon occurences in the two amplicon data sets. The function allows to shift the two extrema (odds ratios OR = 0 and OR = infinity) to the edges of the plot. Plots of multipe ampliconduo data frames are arranged in a 2-dimensional array with shared scales.
Usage
plotORdensity(x, log = "x", ncol = 2, adjust.zeroinf = TRUE, zero.pos = 0.005,
inf.pos = 200, binwidth = 0.15, color = "black", xlab = "odds ratio",
save = FALSE, path = NULL, file.name = NULL, format = "jpeg", ...)
Arguments
x |
List or a single ampliconduo data frame, return value of the |
log |
Optional. Character specifying the variables to transform to log (“”,“x”, “y”, or “xy”). Default is “x”. |
ncol |
Optional. Integer value specifying the numer of columns used to arrange the plots. Default is 2. |
adjust.zeroinf |
Optional. Logical, specifies whether the density bar for 0 and inf should be shifted. Default value is |
zero.pos |
Optional. Numeric, in case |
inf.pos |
Optional. Numeric, in case |
binwidth |
Optional. Numeric, bin width to use, default is 0.15. |
color |
Optional. Character, name of the color used to draw the density bars. Default is “black”. |
xlab |
Optional. Character, label for the x-axis. Default is “odds ratio”. |
save |
Optional. Logical, |
path |
Optional. Character, in case the argument |
file.name |
Optional. If argument |
format |
Optional. Character specifying the format of the saved file. One of “eps”, “ps”, “tex”, “pdf”, “jpeg”, “tiff”, “png”, “bmp”, “svg” and “wmf” (windows only). Default format is “jpeg”. |
... |
Optional. Allows to pass other aesthetics. |
Author(s)
Anja Lange & Daniel Hoffmann
See Also
qplot, used by plotAmpliconduo.set to create the plots.
facet_wrap, called for 2-dimensional arrangement of the plots.
ampliconduo, generates the input data.
Examples
## loads example data of ampliconduo data frames
data(amplicons)

## plot odds ratio density for amplicon frequencies in ampliconduo data frames
plotORdensity(amplicons)
plotORdensity(amplicons[1:4], binwidth = 0.1, color = "magenta")
plotORdensity(amplicons[[1]], binwidth = 0.1, color = "orange", main = "Sample FU25")
plotORdensity(amplicons[1:4],  color = "darkblue", ncol = 2)
Sampling Site Short Names
Description
Character vector with the names of the sampling sites, corresponding to
the names used to denote amplicon frequencies in
the ampliconfreqs data.
Usage
data(site.f)Format
The format is: chr [1:8] "FU25" "FU28" "FU31.1" "FU31.2" "FU34" "FU37" "UniPond" "BogSoil"
References
Boenigk J, Heider D, Jost S, Lange A, Budeus B, Schilling E, Strittmatter A, Hoffmann D: A high-throughput amplicon sequencing and analysis protocol for comparative analyses of microbial communities (submitted)
Examples
data(site.f)
data(ampliconfreqs)
ampliconduo(ampliconfreqs[,1:6], sample.names = site.f[1:3])